AUD/USD came very close to it's long term upper trend support which is currently working as resistance. It broke this support and close below it on Sept 23, 2011. Now it's back again to that resistance level of .9960/70. If it close above it then probably short term down trend is over for this currency pair.
World economy is not out of the woods yet. Euro solved some temporary issues but long term still not clear.
We will watch this level for AUD/USD and short the pair if it fails to close above the level.
Watch:
.9960/70 for resistance.
Weekly chart of AUD/USD posted below.
Monday, October 10, 2011
Saturday, July 23, 2011
Sunday, May 8, 2011
Monday, March 21, 2011
GBP/CHF TECHNICAL ANALYSIS
Sentiment: Bullish
Current Resistance: 1.4782
Current Support: 1.4530
Trade Idea: Go long if 4hr. chart stays above 1.4782 in the European Session.
Daily Target: 1.4900 Which is Bollinger band midpoint and also 38.2% fibo.
Please see chart for the details.
Day Trade Forex With Global Fx Signal. Click Here For Details.
Saturday, January 29, 2011
Sunday, January 9, 2011
U.S. Dollar Index - Outlook For Jan 10 - Jan 14
U.S. Dollar Index closed at 81.13 on Friday. This is just shy off Nov 30th high of 81.44. Last time U.S. Dollar Index fell from that level to as low as 79 on Dec 3rd, 2010.
Technically, it's a short term resistance.
Next week will be very interesting to see if it can break above that level. If it does then we expect U.S. dollar index to go as high as 83.55 which is August 24th high and can act as a very strong resistance.
RSI is not at overbought level. So, there are possibility to move further up in coming week.
Last week, we got mixed economic data came out of U.S. Next week, we will be watching mainly Fed's Beige Book Economic release which is due on Jan 12th and also U.S. retail sales. These two report will give pretty good idea of current U.S. economic outlook and will move dollar accordingly.
See the USD Index chart below.
VISIT OUR WEBSITE: http://www.globalfxsignal.com/
Saturday, January 8, 2011
Sunday, January 2, 2011
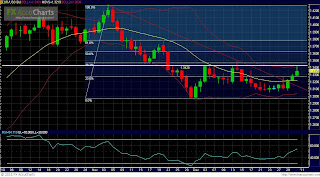
EUR/USD Outlook for the week of Jan 3rd. to Jan 7th, 2011
EUR/USD closed at 1.3354 after a three days rally at year end.
Euro zone countries still facing challenges going to 2011 with sovereign debt crisis. Now, investors are waiting to see who is next to ask for bailout Portugal or Spain? Rating companies keep threatening for downgrades and they have some countries in watch list for next month. Things are not pretty for Euro going to 2011.
Let’s keep the fundamental problem on the side and let’s look at the technical side of Euro/USD for coming weeks.
From our technical analysis, we see the first resistance at 1.3428 which is Dec 3rd and Dec 13th high. If you look at the chart below, you will see that Euro/Usd fell from that level every time it touched. On Dec 31st, it went high to that level and then closed below it. Also, there is a near term resistance at 1.3467 which is 38.2% of fibo retracement from 1.4280 – 1.2970.
We will take a bullish position, if Euro/Usd close above 1.3467. Next resistance will be at 1.3621 which is 50.0% fibo.
On the lower side, we see the first support at around 1.3120.
BEST OF LUCK IN 2011!
VISIT OUR WEBSITE: GLOBAL FX SIGNAL
Subscribe to:
Comments (Atom)


