Friday, December 3, 2010

Next Week Currency Watch EUR/GBP

EUR/GBP closed at a very important level of .8502. Why it is important? Because that level acted as a resistance on July 19, 2010 and then it fell from that level to .8150 before it bounced back to .8900 in October 2010. This is also just above 20SMA and the mid point of Bollinger band. MACD showing oversold and there is a sign of reversal. Last but not least, .8502 is very close to 50% fibo retracement of .8538 which also can act as a short term resistance.


Our strategy: Take long if daily close at or above .8538. TP will be .8610 and SL below .8470

See our monthly performance: Peformance Calender 

Saturday, November 20, 2010

EUR/USD Outlook Remains Bearish , November 19, 2010

The latest slide has finally stopped after ending a sequence of consecutive daily lower highs, and it seems the market starts the process of correcting the latest major 1.4285-1.3445 move. While there is certainly room for additional upside movement from current levels (1.3715), our outlook remains bearish following the break below 1.3700 several days ago. The 38.2% fib retracement off of the latest move comes in by 1.3760, with the level also offering itself as the midpoint between the 10/20-Day SMAs.
STRATEGY: Sell is set at 1.3760 or 1.3780 for an Open Objective; STOP is set at 1.3850.


Performed by Gerardo Porras Palomino, Analytical expert
InstaForex Companies Group © 2007-2010

Get a Three Weeks of Free Trial Plus one month of free signal when you signup with "InstaForex" 

Saturday, November 13, 2010

EUR/CAD Opportunity You Don't Want To Miss....

EUR/CAD bounced back from it's oversold position on Friday. It closed @ 1.3823. Weekly low was 1.3658.

CCI and Bollinger band both showing rebound from oversold position but still in negative position.

Euro was under much pressure last week on speculation that Ireland was on the verge of a EUR 80b bailout from EU and IMF. The rumors sent CDS on peripheral Eurozone countries to record high, as well as respective bond spread with benchmark German bund. Nevertheless, the rumor was denied by Irish finance ministry on Friday. Investors were also worried that Germany will push forward measures to have bond holders sharing the burden in future bailout of countries in fiscal problems. But investors were then calmed down by a joint statement by UK, France, Germany, Italy and Spain that "any new (bailout) mechanism would only come into effect after mid-2013 with no impact whatsoever on the current arrangements".

If no new bad news comes out of Euro next week, we will expect Euro to rally against CAD. We will be looking for a long position on any pullback from this level.

We closed last week with +190 pips profit and our Managed account gained +4.3% for the month of October.

For free forex signal, please visit us @http://www.globalfxsignal.com/


Wednesday, November 10, 2010

EUR/USD Range Bound Possible

EUR/USD hovering near lower bollinger band and near it's short term support at 1.3730. CCI also showing oversold level. Maybe, it's time for a bounce.
Our daily bias remains neutral. We think EUR/USD might get stuck in a range bound between 1.3730 and 1.4250 in near term. See the chart below.
Break below 1.3730 will cause a major damage to it's recent upside move.

Signup up with "InstaForex" and get free three weeks of our signal service. Visit: Global Fx Signal for details.

Sunday, October 17, 2010

USD/CAD Outlook For The Week Of Oct 18-22

Last week, USD/CAD touched the parity mark and then bounced back from there. At the beginning of last week, all commodity currencies moved higher against the US dollar as Oil and Gold hit high for the week. Gold touched all time high this month and seems like no stop near sight. Oil price fell on Friday and that brought Canadian Dollar back from parity.
Coming week is very important for USD/CAD as Canadian Rate decision on Tuesday at 14:00 GMT (9:00 AM NY Time).

The Bank of Canada expects the economic recovery in Canada to be more gradual than it had predicted in its July Monetary Policy Report although consumption and investment have evolved largely as anticipated. The previous inflation rate grew by 1.00% following 0.75% rise in July. September’s inflation rate is expected to remain 1.00%. A gradual increase is inflation rate will provide backing to the Canadian growing economy.

On technical level, USD/CAD closed doji on a weekly chart. In candlestick term, it's a sign of reversal. In our weekly, bolinger band chart, you can see USD/CAD just closed above the lower bolinger band. If the price can closes above 1.0180 on a daily chart then, USD/CAD can go as high as 1.0350 before the next resistance.
Good Luck Everyone On Your Trading Next Week.

Visit Us: Global Fx Signal For Free Trade Alert.

Thursday, September 30, 2010

USD/CAD Continues Range Bound

In September, USD/CAD got stuck in a range between 1.0200 and 1.0350. See the chart below.
Some traders may find it difficult to trade but we think it's easy to trade when prices are stuck in a range. We did few profitable trades by taking the advantage of this move.
We bought when price moved to the bottom range and sold when the price went close to upper ragne.
USD/CAD is in breakout watch. We are waiting to see a break above 1.0350 or below 1.0200.
That might happen anytime soon.

Visit Us: Global Fx Signal

Saturday, September 18, 2010

Dollar Index Outlook

Dollar index's strong break of 81.88 support completed a head and shoulder top pattern which suggests that rebound form 80.08 is already finished. Also, note that dollar index has indeed failed to take out 55 days EMA, which in turn argue that whole fall from 88.70 is possibly still in progress for another low 80.08. In such case, we'll be looking at the prospect of deeper medium term decline to 75 level upon breaking of 80. In any case, risk will now be heavily on the downside as long as 81.88 resistance holds and further fall will be in favor. Though, break of 81.88 will save the bullish case that 80.08 is the bottom and will turn focus back to 83.56 resistance instead.


Tuesday, September 14, 2010

USD/JPY - Japan's Invervention In Currency Market

Japan intervene in the currency market on Sept 15th, 2010. Last time they intervene the market to stop selling USD against JPY was six years back. Please see the chart below.
We were able to get some bite out of it.


Friday, September 3, 2010

Our Position Explained

EUR/USD opened a week at 1.2759 which was just below 38.2% fib at 1.2781 (See the chart below). This is second bullish weekly closed for EUR/USD and closed above 38.2% fib. We took our long position at 1.2869 and currently up +23 pips with one lot EUR/USD. You can see that on the chart below. We left the position open for next week, as we expect EUR/USD to continue its upward move.
NFP report came better then expected and investors are getting into more risky assets like EUR/USD. On the other hand, JPY fell against most of the major currencies. We don’t believe it’s a one day action. We placed our profit target at 1.2950 which is just below 1.2993 next resistance. Our stop loss is at 1.2800. That is 1:1 risk reward.


Have a nice long weekend, Canada, U.S.

Visit us: GLOBAL FX SIGNAL

Tuesday, August 31, 2010

Screen Shot Of Our Recent Trades

In August, we did 436 pips for the month.


Visit us: Global Fx Signal

Sunday, August 29, 2010

EURUSD Weekly Outlook

As we look at the charts last week, the weekly closing turned out to be a doji, which leads to indecision in market, but if we consider it has made new low last week and yet to make a new high, this means that downtrend is still in place.

Technically this pair is still trading below 1.2781 key level which is a strong resistance and a 38.2 fib level from its low of 1.1881 to 1.3337. For bullish reversal confirmation, EURUSD weekly close needs to be above 1.2781. The next support for EURUSD can be seen at 1.2609 which also 50.0 fib from it’s 1.3337 high. Ironically, it was also close to last weeks low of 1.2586. EURUSD bounced from that level.

We are bearish at this point until we see the clear sign of upward move.

SIGNUP FOR FREE SWING TRADE SIGNAL: GLOBAL FX SIGNAL

Saturday, August 14, 2010

Strategy For EURUSD - Week of August 16-20

EURUSD had a biggest weekly fall last week. We are still bearish with EURUSD and looking to short below 1.2720. Please see the chart below for our analysis.

Global Fx Signal provides free swing trade alerts for long term traders. Signup Free.

Tuesday, August 10, 2010

EURUSD Update II

We have reached the target of 1.3150. EURUSD dropped as per our technical analysis. Please read previous two blogs. See how accurate it is.
A good technical analysis can save you from lot of grief.

Visit Us: Global Fx Signal

Monday, August 9, 2010

EURUSD Update

On our previous blog we mentioned EURUSD overbought position, As expected it started to fall from the begining of the week.
We took the short position based on our analysis and currently +55 pips profit. Our profit target at 1.3150.
We will close our position at that level.
For forex signal, visit us: Global Fx Signal


Friday, August 6, 2010

EUR/USD Technical Analysis – Bollinger Band

Bollinger bands are one of the most popular technical indicators for traders in any financial market - stocks, bonds or foreign exchange (FX). Many traders use them primarily to determine overbought and oversold levels, selling when price touches the upper Bollinger band and buying when it hits the lower Bollinger band. In range-bound markets, this technique works well, as prices travel between the two bands like balls bouncing off the walls of a racquetball court.


Currently, EUR/USD hugging upper Bollinger Band which technically considered as overbought level. Trend is still upward. MACD also confirms daily overbought level for this pair.

We will be watching how it opens next week. We think there are possibility of pullback from this overbought level. If that happens, then, EURUSD has a chance to come down to the mid level of Bollinger Band which is 1.2972.
Visit Us: Global Fx Signal

Saturday, July 17, 2010

GBPUSD outlook for the week of July 19-23

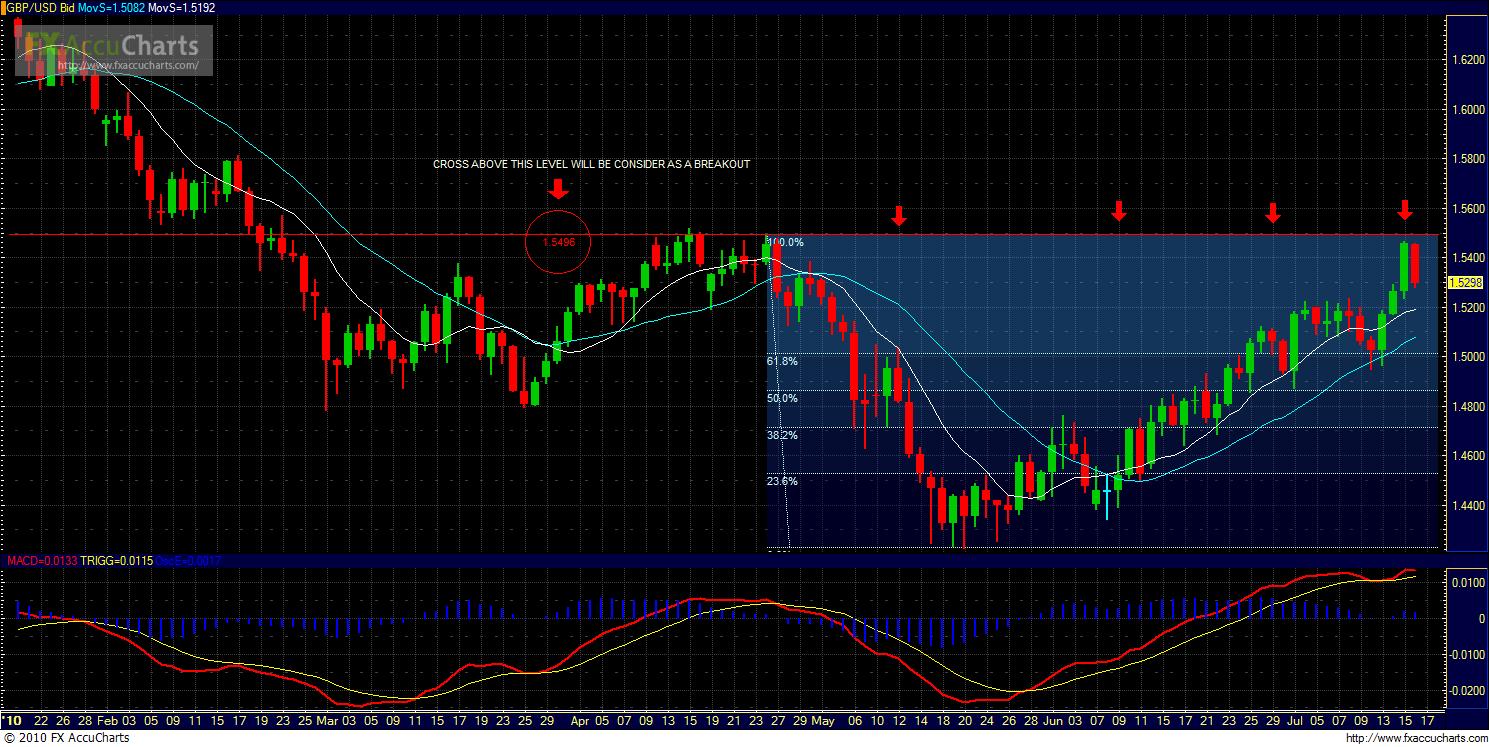
GBPUSD did very well last week until Friday. It reversed it’s bullishness and dropped over 150 pips from it’s Thursday high. If you look at the chart below, you will see why? GBPUSD recovered almost 100% of it’s Fibo retracement from it’s May 17th low of 1.4249 to April 26th high of 1.5495.
So, 1.5495 becomes a resistance at this point. GBPUSD need to break this level to go higher.

Next week's strategy for GBPUSD:

We will be watching that resistance level to go long, if any breakout happens. Ofcorse, we have to be careful for any false breakout. Trend is still bullish until we see it goes below 1.5235.

On economic calendar, there is a very important news for GBPUSD and that is

British GDP: released on Friday at 8:30 GMT.

After lagging behind other countries, Britain saw two quarters of growth. Last quarter’s 0.3% growth rate which was confirmed just last week, will probably be followed by a stronger growth rate in Q2. We’ve seen better numbers at the unofficial NIESR release. Note that the preliminary release, like now, is usually worse than the final outcome. A growth rate of 0.6% is expected now.

Next week will be very interesting to watch GBPUSD for any clue of reversal.

No time for market research? Let us send you a signal to trade. Visit us: Global Fx Signal

GBPUSD Daily Chart

Tuesday, July 13, 2010

Euro/Usd Midweek Update

Even though, German Zew Report came worse then expected Euro went higher against US dollar today. The reason more likely overall risk averse sentiment going positive towards EURO and GBP.

On our previous blog we talked about 1.27 resistance for Euro and today Euro broke that level and went higher.
Now, we are looking for next big resistance at 1.3124 which is 38.2% fibo (Please read previous blog). It will not happen overnight but we don't see any big resistance before that on a daily or weekly chart.

Need Forex Signal? Visit us: Global Fx Signal

Saturday, July 10, 2010

Where will be Euro next week?

Looking at the daily chart, we can see EUR/USD touched the top side of a down channel which started from December 2009.


We will be watching this level (1.2700). If it can break and go above that level then the next level will be 1.3124 which is also a 38.2% Fibo from high of 1.5137 and low of 1.1881.

We are holding neutral bias at this critical point.

Next week’s important news for Euro will be German ZEW Economic Sentiment: Published on Tuesday at 9:00 GMT. This can move the currency in either direction.

Learn technical analysis to profit from the market. Visit us: http://www.globalfxsignal.com

Tuesday, June 29, 2010

Mid Week Update of GBP/USD

As we mentioned on our previous blog that for GBP/USD to go down it needs to go below 61.8% fibo which is working as a strong support at this point.
Please see the chart below where it shows clearly that GBP/USD keep bouncing back from that level.
We have couple of days left for this week. It will be interesting to see if GBP/USD can keep itself above that level for the week.

Visit us at: GLOBAL FX SIGNAL

Sunday, June 27, 2010

GBP/USD week of June 27th - July 2nd.

 G20 Toronto Summit came up with a commitment to reduced deficits by 2013. It’s good move for G20 countries if they can keep their commitment and work towards it.
How it will effect currencies? We will find that out when market will open in few hours time.
We are going to analyze GBP/USD based on technical not on G20 commitment.
On Friday, GBP/USD closed above 1.5057 which is just above 61.8% fibo (See chart below).  Now, we will be watching this level. If GBP/USD can continue stay above that level then there will be a good chance for this pair to reach 1.53 level by end of next week.
In economic calendar, there are few important releases next week which can move the currency in either direction:
  1. Nationwide HPI: Publication time unknown at the moment.
  2. Net Lending to Individuals: Published on Tuesday at 8:30 GMT.  
  3. GfK Consumer Confidence: Published on Tuesday at 23:00 GMT.
  4. Final GDP: Published on Wednesday at 8:30 GMT.
  5. Current Account: Published on Wednesday at 8:30 GMT, and overshadowed by the GDP.
  6. Manufacturing PMI: Published on Thursday at 8:30 GMT.
  7. BOE Credit Conditions Survey: Published on Thursday at 8:30 GMT, and somewhat overshadowed by the PMI release.
  8. Construction PMI: Published on Friday at 8:30 GMT.
 Visit us: http//www.globalfxsignal.com  


Saturday, June 19, 2010

EUR/USD Weekly Outlook Jun 21-25th

Euro/Usd had a good run last two weeks. After reaching all time low at 1.1875 Euro/USD bounced back against the dollars.

In weekly chart (see below), we can see a bullish move and expecting to continue this next week.
Looking at next resistance for Euro/Usd at 1.2658 which is a 23.6% fibo retracement (high 1.5160 and low 1.1875) and also touching point of 10 sma.

Breaking below 1.23 poses a risk to go lower and re-test the recent low.

Need to improve your forex skills? Visit us: http://www.globalfxsignal.com/


Thursday, June 3, 2010

GBP/USD Need To Break 1.4700 For Next Leg Up

GBP/USD moving in a very tight range between 1.4700 and 1.4300 since May. Though some positive data came out of UK this week but that wasn't strong enough to break 1.4700.
The Guardian News Paper reported that "The UK's recovery is likely to lag European neighbours France and Germany this year, according to economists at Standard & Poor's, who warn this morning that uncertainty around gaping budget deficits could hurt growth throughout the region."
Investor's are not confident on European growth this year due to the big budget deficit on few European Countries.
Back to the currency, we think GBP/USD needs to break 1.4700 and stay above that level to move further up.
Daily and Weekly positive so far and that pointing some positive bias towards this currency pair. NFP report is due tomorrow and that will move the pair in either direction. If GBP/USD can close the week in positive note then we think it will have better chance to break 1.4700 level by next week.

Need forex training? Visit us: http://www.globalfxsignal.com/


Saturday, May 22, 2010

USD/CAD Week Ahead

Last week, USD/CAD came close to a very strong resistance. If you look at the chart you can see that 1.08 is a strong resistance since January 2008. USD/CAD broke that level last time on January 2008 and went as high as 1.3022 & fell since then.


Last Friday, USD/CAD almost touched that level of 1.08 and fell (See the chart below). It closed below 1.0673 (23.6% Fibonacci Retracement from 1.3040).

Next week, we will be watching to see whether USD/CAD can break that resistance of 1.08. If it does then it can go as high as 1.11 which is the next resistance for USD/CAD and near its 38.2% fibo retracement.

Monday is a Victoria Day Holiday for Canada. All banks are closed .

In economic calendar, there is only one important news for Canada that is Current Account Balance which is due on Friday and forecasted for -8.7B.

So, for us it will be a breakout watch for USD/CAD @ 1.08.

Want to be a master on technical Analysis? Join our class for online training @ http://globalfxsignal.com/forex_training.html


Sunday, May 9, 2010

GBP/USD May 9-14 Outlook

It was quite a week last week. Bears had their full control on currency direction and I am sure lots of us made good money shorting.


Well, what about next?

We are going to analyze GBP/USD for you.

First thing which caught our eyes is the daily closing price of GBP/USD. If you look at our chart below you will see that GBP/USD closed at 1.4809 which is just above of 0.0% fib of 1.4785 (1.6867 Nov 16th High -1.4785 March 25th, Low).

Next, if it can stay above of that price then we think it will go higher. But breaking this level can take it down to as low as 1.37 (Jan 16th. close).

European problem is not settled yet and UK hung parliament also the reason for last week’s fallout.

Need Forex Training On Technical Analysis? Please visit: http://globalfxsignal.com/forex_training.html

Thursday, April 22, 2010

EURUSD touched a very critical level

EURUSD touched 1.3340 level which is also a support for previous downward line. Break below can fall further to 1.3269 which was a strong support since March.
Visit us @ http://www.globalfxsignal.com/

Sunday, April 11, 2010

Trader Mindset Video by Larry Levin

Trader Mindset CD Video from Chelsey Krull on Vimeo.

Euro Outlook April 12-16

Euro rallied on late US session based on a rumor that the Greece would receive financial help from the European Union and the International Monetary Fund as soon as this weekend. Fitch Ratings downgraded the Greece two notches to the lowest investment-grade rating but that didn't stop Euro rally.


In technical view point, we see that euro closed on a very critical price point. If you look at the chart you can see that the Euro closed just little above 61.8% fibo retracement of 1.3484 which is March'08 low of 1.2662 and Nov'09 high of 1.5135. It also touched the top line of downward channel and 20 SMA.

Next week, Euro either will break above its current resistance or fall below it. If Euro stays above 1.35 then the next resistance will be at 1.38 levels. Which is a very strong resistance for Euro at this point. Euro couldn’t break that level since February after multiple try. On the other hand 1.3250 is also a strong support for Euro. It dropped to that level and quickly bounced back few times last month.

Until the Greek issue is solved Euro might move sideways between 1.3250 and 1.38 in coming weeks.

Visit us: http://www.globalfxsignal.com/

Saturday, April 3, 2010

Eur/Usd Outlook April 2-9

The manufacturing PMIs showed strong gains in March, with global index rising 1.3 pts to 56.7. The March reading delivered a new high for the expansion and is just a point below the series high dating back to 1998. The output and orders components of the global PMI rose to near 59, consistent with robust growth in global factory production in the near-term of at least 7% annualized.

U.S. employers added 162,000 jobs in March, the largest gain since 2007. But nearly one-third came from temporary hiring for the Census. The unemployment rate was steady at 9.7%. US is in a slow recovery mood. Dollar gaining momentum.

EUR/USD in a downward channel since december. If you look at the daily chart you can see that EUR/USD hit resistance near 1.36 and then fell. We think at this point 1.36 is a strong resistance for Euro. If it break that then it can go up 1.38 March 17th. high. As per daily chart, the next support can be at 1.3250.
Looking at next week calender, all European banks are closed on Monday and there are no ecomomic news due for Euro. Only important news for Euro will be Germany factory orders. Which is due on Wednesday.
Overall, Euro still holding bearish sentiment going to next week.
Visit us: http://www.globalfxsignal.com/

Wednesday, March 24, 2010

GBP/USD MAR 25TH OUTLOOK

Greek crisis along with Portugal's rating downgraded by Fitch fueled the sell off yesterday.
European leaders are meeting for a two-day summit in Brussels tomorrow driven by disputes over whether and when to rescue Greece from financial collapse. Euro sinks it’s lowest against the dollar in 10 months. GBP came closer to March low and below it's 61.8% fibo at 1.4950.
Market bias negative for all currencies against dollar could continue tomorrow but there could also be a short term bounce from oversold position.
We think GBP/USD might get some push towards 61.8% fibo level at 1.4947. That also could be a resistance. If it can pass through that level then we think it will hit the next resistance at 1.5039 which was yesterday’s high.
Downside risk will be limited at 1.4781 March low short term.

Friday, March 19, 2010

Eur/Usd Outlook Mar 22-26

Eur/Usd continued moving within it's range between 1.3400 and 1.3800 since February. On Mar 17th it failed to break above 1.3800 and fell harder the next day.
Eur/Usd is the most bearish currency pair of all. Economic news out of Europe are not strong enough to move this currency higher or break above it's current range. Greek debt crisis is also hurting euro.

We will see how it unfold next week. We did few good trades shorting Euro from it's high. We are bearish on Euro but will be careful as it is coming closer to it's support at 1.34 and also near it's 61.8% fibo support area at 1.3484.

Don't forget to write a comment. We would love to hear from you.
This is our new blog and we are looking forward to your support.